Assets Gadgets for Jira — complete user guide
Every setting explained — global access modes, the My Assets JSM portal, and all ten dashboard gadgets (AQL Counter, Pie, Donut, Bar, Stacked Bar, Date vs Date, tables). With best practices and a troubleshooting table.
Overview
This is the full user guide for Assets Gadgets for Jira (Dashboards & Reporting) — a Forge app for Jira Cloud. It provides dashboard gadgets for Jira Assets data (AQL) and the My Assets view in the Jira Service Management portal.
- Jira Dashboard — counters, charts, and tables driven by AQL.
- JSM Portal — My Assets for end users (read-only).
- App admin — global access mode, portal tables, and performance limits.
1. Global Settings
Open admin settings
Jira → Settings → Apps → Manage apps → Assets Gadgets for Jira Dashboards & Reporting → Configure
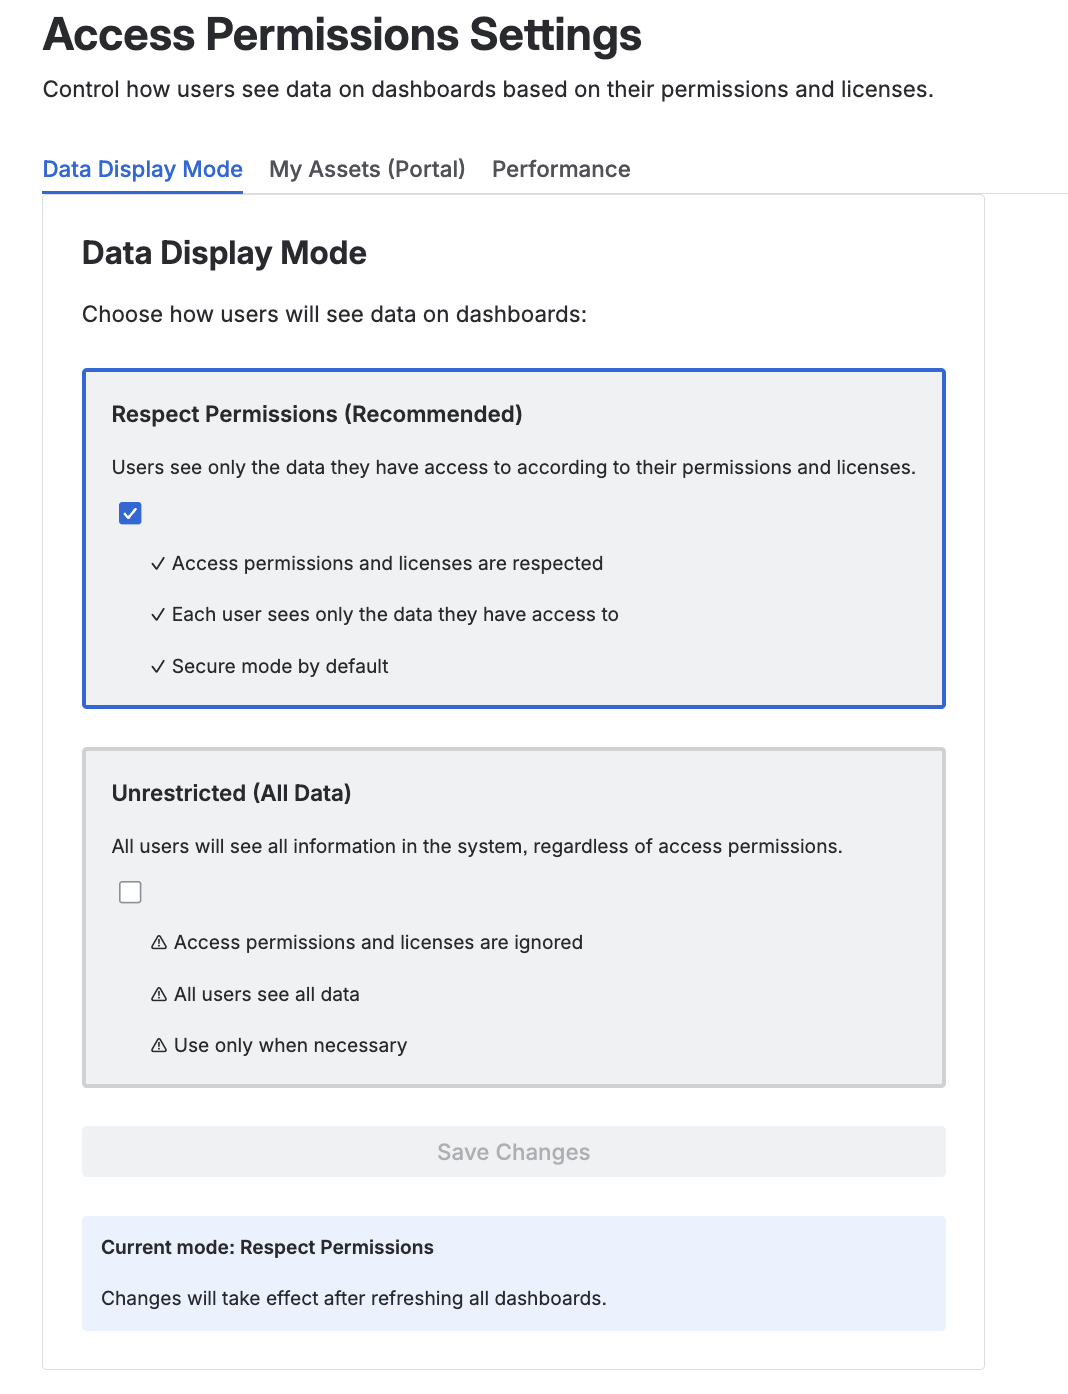
The page title is Access Permissions Settings. It has three tabs:
- Data Display Mode
- My Assets (Portal)
- Performance
1.1. Data Display Mode
Controls how dashboard gadgets call the Assets API:
| Mode | Behavior |
|---|---|
| Respect Permissions (Recommended) | Data is fetched as the viewing user. Users see only objects they are allowed to access. |
| Unrestricted (All Data) | Data is fetched as the app. All dashboard viewers see the full AQL result. |
After you change the mode, reload dashboard pages. Gadget configure screens show the active mode and a link to these settings.
Data Display Mode settings
NOTE: Portal tables use their own AQL and group rules on the My Assets (Portal) tab. Data Display Mode applies to dashboard gadgets.
1.2. My Assets (Portal)
See 2.2. Administrators below for how to configure the portal tables shown in My Assets.
1.3. Performance
| Setting | Description |
|---|---|
| Max items per gadget | Maximum objects one gadget loads per request (default 20,000; range 100–200,000). |
| Page size | Objects per AQL page/chunk request. |
| Parallel batch size | Concurrent backend page requests. |
| Fetch time budget (ms) | Soft time limit for fetching; may return partial data before the Forge timeout. |
| Chunk concurrency | Parallel frontend chunk requests for charts. |
| Chunk retries | Retries per failed chunk before marking data partial. |
| Chunk base backoff (ms) | Base delay between chunk retries. |
2. My Assets (JSM Portal)
2.1. End users
Open My Assets
In the JSM portal: user menu (avatar) → My Assets. The view opens fullscreen.
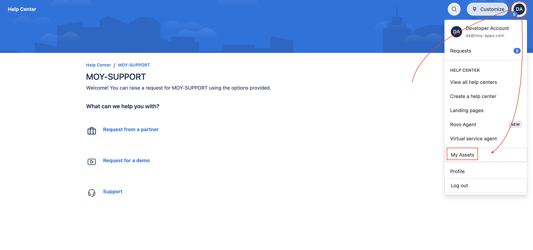
My Assets in the portal user menu
Overview tab
- Total Assets — sum of totals from all configured tables (overlapping AQL may count the same object more than once).
- Up to 3 optional AQL KPI counters (admin-defined).
- Search — filters loaded rows on the client.
- Per-table row previews and View all to open that table's tab.
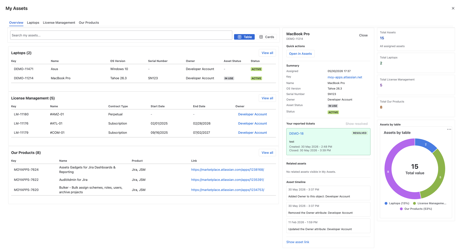
My Assets — Overview tab
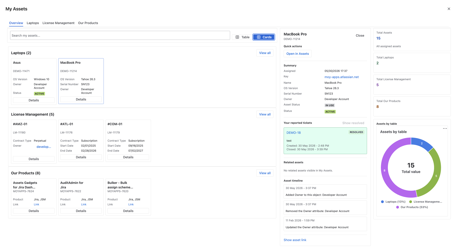
Table tabs
Each configured results table is one tab. Tab order matches the admin list order.
On a table tab:
- KPI strip: Total objects for the table AQL plus optional counters (with optional color/threshold styling).
- Optional distribution chart (donut by attribute).
- Table / Cards toggle (same mode for all tabs in the session).
- Click a row or card to open the detail panel.
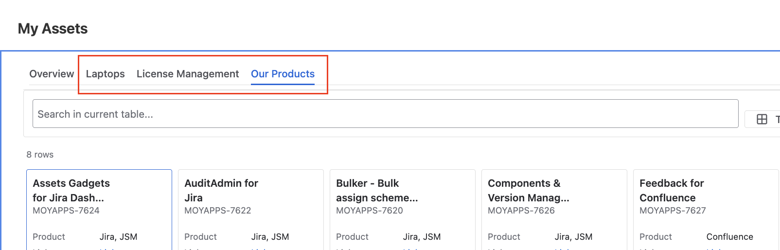
Table tabs
Table mode
- Columns and order are defined by the admin.
- Status values use a lozenge with the column label.
- Object key and reference fields are links where applicable.
- Search filters rows already loaded on the tab or on Overview.
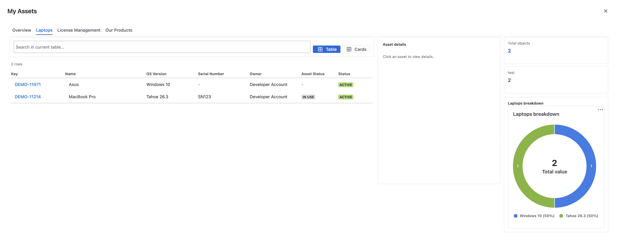
Table mode
Cards mode
- Card header: object name and key (title up to two lines, full name in tooltip).
- Card body: up to three non-empty attributes in column order; status as lozenge.
- URL attributes render as Link (full URL in tooltip).
- View details opens the detail panel.
Cards mode
Detail panel
- Quick actions — available only for users with view object permission.
- Summary — attributes in a two-column layout.
- Your reported tickets — JSM tickets linked to the object, when available.
- Related assets — linked Assets objects.
- Asset timeline — events from admin timeline rules.
End users cannot change AQL, columns, or filters.
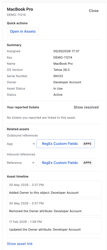
Detail panel
Data scope
Each table uses its own AQL. Per-user filters typically use currentUser() or {{currentUser}}. Shared AQL without a user filter returns the same rows for every portal user.
2.2. Administrators
Global Settings → My Assets (Portal)
Structure
- Overview KPI — up to 3 AQL counters for the Overview tab.
- Results tables — up to 10 tables; drag rows to set tab order on the portal.
- Timeline rules — portal-level rules where configured.
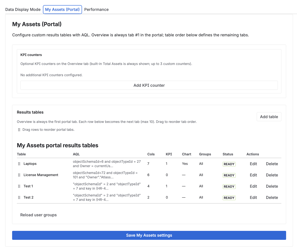
My Assets (Portal) admin configuration
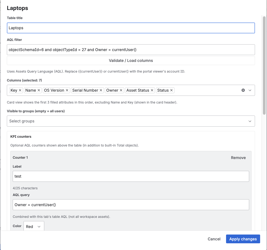
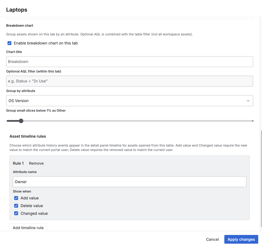
Add or edit a table
- Add table or open Edit on a row.
- In the modal, set the fields below → Apply changes.
- Save My Assets settings on the panel to persist.
| Field | Description |
|---|---|
| Table title | Tab label on the portal. |
| AQL filter | Query for rows. Supports currentUser() and {{currentUser}}. |
| Validate / Load columns | Validates AQL and loads attributes for column pickers. |
| Columns | Multi-select; selection order is column order. Cards show the first three filled attributes (name/key in the header). |
| Visible to groups | Empty = all portal users; otherwise only listed Jira groups. |
| KPI counters | Per-tab counters: name, AQL, optional highlight rules. |
| Distribution chart | Donut by selected attribute on the tab. |
| Timeline rules | Rules for the detail panel Timeline section. |
Each table requires non-empty AQL and at least one column before save.
Add / edit table dialog
Column selection
3. Dashboard gadgets
Ten gadget types are available on Jira dashboards:
- AQL Counter
- Pie Chart
- Donut Chart
- Bar Chart
- Horizontal Bar Chart
- Stacked Bar Chart
- Horizontal Stacked Bar Chart
- Assets Table
- Results Table
- Date vs Date Chart
3.1. Add a gadget
- Dashboard → Add gadget → search Assets Gadgets.
- Select a type → Add → configure → Save or Save & Close.
WARNING: Use schema/type IDs in AQL when possible, e.g.
"objectSchemaId" = 6 and "objectTypeId" = 32. For type trees:objectType in objectTypeAndChildren("Employees").
3.2. Shared gadget UI
Data header (charts and tables that load objects)
- Total objects matching AQL (optional) — count of all objects matching the gadget AQL.
- Scope — e.g. "Chart based on X of Y matching items" or "Table based on…".
- AQL Query (optional) — AQL text and selected attribute(s).
Configure options (where applicable)
| Option | Description |
|---|---|
| Show AQL Query | Show the AQL block in the header. Not available on AQL Counter. |
| Show Total objects matching AQL | Show the blue total block. |
| Show truncation info | Show Limited or partial-load messages. |
| Number of Results | Max objects for this gadget (minimum 5, maximum = global Max items per gadget). Empty uses the global maximum. |
Configure shows the current Data Display Mode and a link to Global Settings.
Pie and Donut only
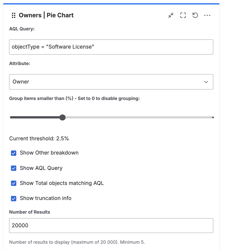
- Group items smaller than (%) — 0–10%, step 0.5; 0 disables grouping into Other.
- Show Other breakdown — button to expand a table of items in the Other bucket (Name, Count, %).
Chart attributes
Grouping attributes: Status, Select, Date, Boolean, User, Object, Group, Project.
Limits
- Global ceiling: Max items per gadget in Performance settings.
- Limited — result capped by gadget or global limit.
- Partial — not all chunks loaded (time budget, errors, rate limits). Enable Show truncation info to display this.
3.3. AQL Counter
Shows one or more numeric counts from AQL.
| Setting | Description |
|---|---|
| Counts | Up to 10 rows: Name (max 25 characters) + AQL Query. |
| Layout | If more than one count: Stacked, Single row, or 2 / 3 / 4 columns. |
| Highlight | Per count: text color, optional emoji, threshold (above / below / equal). |
Each count loads independently; an error on one count does not block the others.
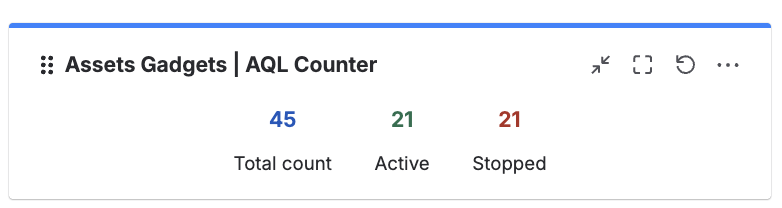
AQL Counter gadget
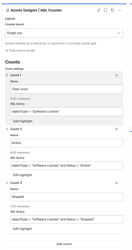
AQL Counter configuration
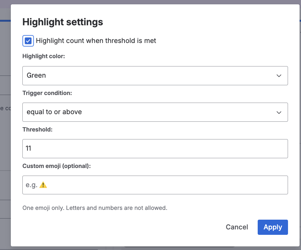
Highlight settings
3.4. Pie Chart
Distribution of objects across one attribute, drawn as proportional slices. Settings: AQL, grouping Attribute, Other-grouping threshold, shared header options, Number of Results.
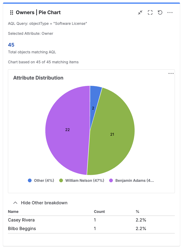
Pie Chart
Pie Chart configuration
3.5. Donut Chart
Same as the Pie Chart, with a hollow center that shows the total. Useful when you want the part-to-whole split and the grand total in one view.
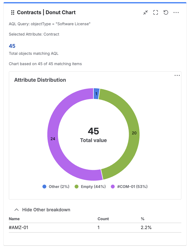
Donut Chart
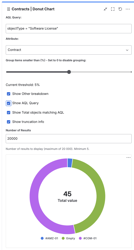
Donut Chart configuration
3.6. Bar Charts
Counts per attribute value, drawn as bars. Four variants share the same configuration:
- Bar Chart — vertical bars, one per attribute value.
- Horizontal Bar Chart — the same, rotated for long labels.
- Stacked Bar Chart — each bar split by a second attribute (stack-by).
- Horizontal Stacked Bar Chart — stacked, rotated.
Settings: AQL, grouping Attribute (plus a Stack-by attribute for stacked variants), shared header options, Number of Results.
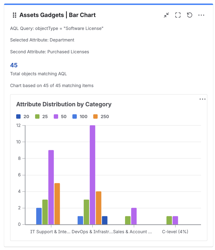
Bar Chart
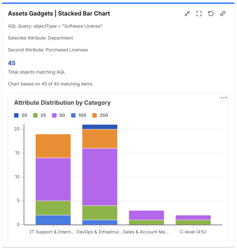
Stacked Bar Chart
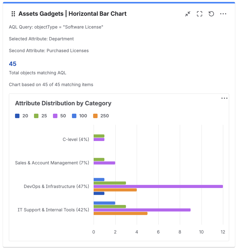
Horizontal Bar Chart
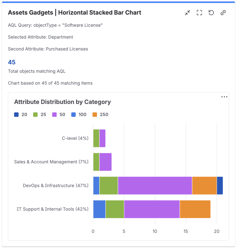
Horizontal Stacked Bar Chart
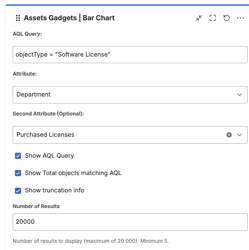
Bar Charts configuration
3.7. Assets Table
Table of attribute values with count and percentage.
Settings: AQL, Attribute, shared header options, Number of Results. No footer total row.
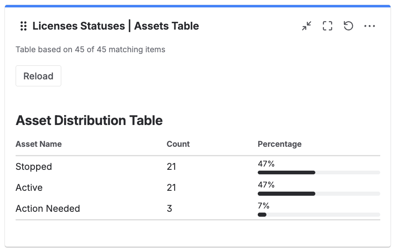
Assets Table
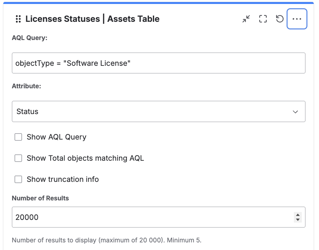
Assets Table configuration
3.8. Results Table
Table of objects with selected columns. Key and reference columns are links.
Settings: AQL, columns, Show AQL Query, Show Total objects matching AQL, Show Table total, Show truncation info, Number of Results.
Show Table total: Footer row labeled Total; sums numeric columns across loaded rows; other columns show "-".
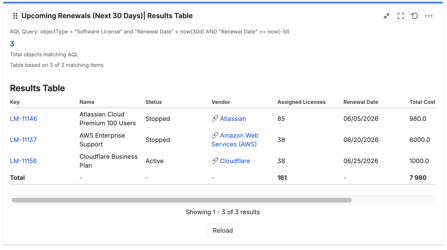
Results Table
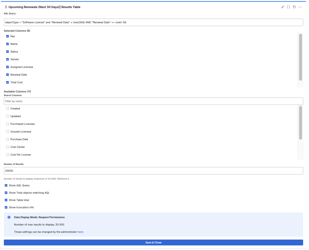
Results Table configuration
3.9. Date vs Date Chart
Time series from one or two date attributes on objects matching the AQL.
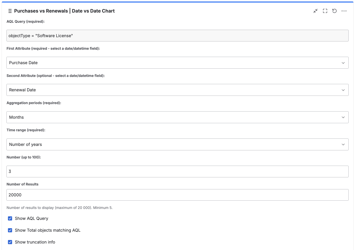
Settings: AQL Query, First Date Attribute, Second Date Attribute (optional), Aggregation Period (days / weeks / months), Time Range, Time Range Number, shared header options, Number of Results.
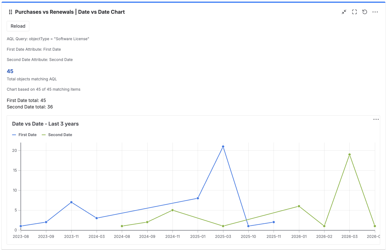
Date vs Date Chart
Date vs Date configuration
INFO: AQL documentation: Use Assets Query Language (AQL) · How to use AQL
4. Best practices
- Keep AQL selective to reduce load time and API usage.
- Use Show AQL Query while testing; turn it off on production dashboards.
- Pie/Donut: set a non-zero Other threshold when there are many small segments.
- Results Table: select only needed columns; enable Show Table total only for numeric rollups.
- AQL Counter: stay within 10 counts; keep each AQL query fast.
- My Assets: filter personal data with
currentUser()or{{currentUser}}; restrict tables with Visible to groups when needed. - Leave Respect Permissions enabled unless all users must see unrestricted dashboard data.
- Adjust Performance if you hit timeouts or rate limits.
5. Troubleshooting
| Issue | Check |
|---|---|
| No data | AQL syntax; Data Display Mode; user Assets access and license |
| Slow load | Narrower AQL; lower Number of Results; Performance page size and concurrency |
| Limited / truncated | Result exceeds limits — refine AQL or raise Max items per gadget |
| Partial data | Time budget or chunk errors — Show truncation info; lower parallel settings |
| AQL error in gadget | Fix the query shown in the error message |
| One AQL Counter empty or in error | That count's AQL only |
| Results Table Total incorrect | Column must be numeric in Assets |
| My Assets tab empty | Table AQL; group visibility; object permissions |
| Overview Total seems too high | Overlapping AQL across tables |
| Permission change not visible on dashboard | Reload the dashboard |
6. Support
Questions or a feature request? Reach us through the Marketplace support page.
FAQ
How do I control whether users see only their own Assets on a dashboard?
Open Global Settings → Data Display Mode. Respect Permissions (Recommended) fetches data as the viewing user, so each person sees only objects they are allowed to access. Unrestricted (All Data) fetches as the app, so every dashboard viewer sees the full AQL result. Reload dashboards after changing the mode.
How many AQL counts can one AQL Counter gadget show?
Up to 10 counts in a single AQL Counter. Each has its own name (max 25 characters) and AQL query, and loads independently — an error on one count does not block the others. Layout options include stacked, single row, or 2 / 3 / 4 columns.
What is the difference between the Assets Table and the Results Table gadget?
The Assets Table aggregates one attribute into values with count and percentage (no total row). The Results Table lists individual objects with the columns you select, links key/reference fields, and can show a Total footer row that sums numeric columns across loaded rows.
How do I show each portal user only their own assets in My Assets?
In each My Assets table's AQL filter, use currentUser() or {{currentUser}} so the query resolves to the signed-in portal user. Shared AQL without a user filter returns the same rows for everyone. You can further restrict a table with Visible to groups.
Why does a gadget show "Limited" or "Partial"?
Limited means the result was capped by the gadget's Number of Results or the global Max items per gadget. Partial means not all data chunks loaded within the fetch time budget, or some chunks hit errors or rate limits. Enable Show truncation info to surface these states, then narrow the AQL or adjust Performance settings.